FinTrack: Expense Tracker and Analytics Dashboard on the MEAN Stack
9 Oct, 2026
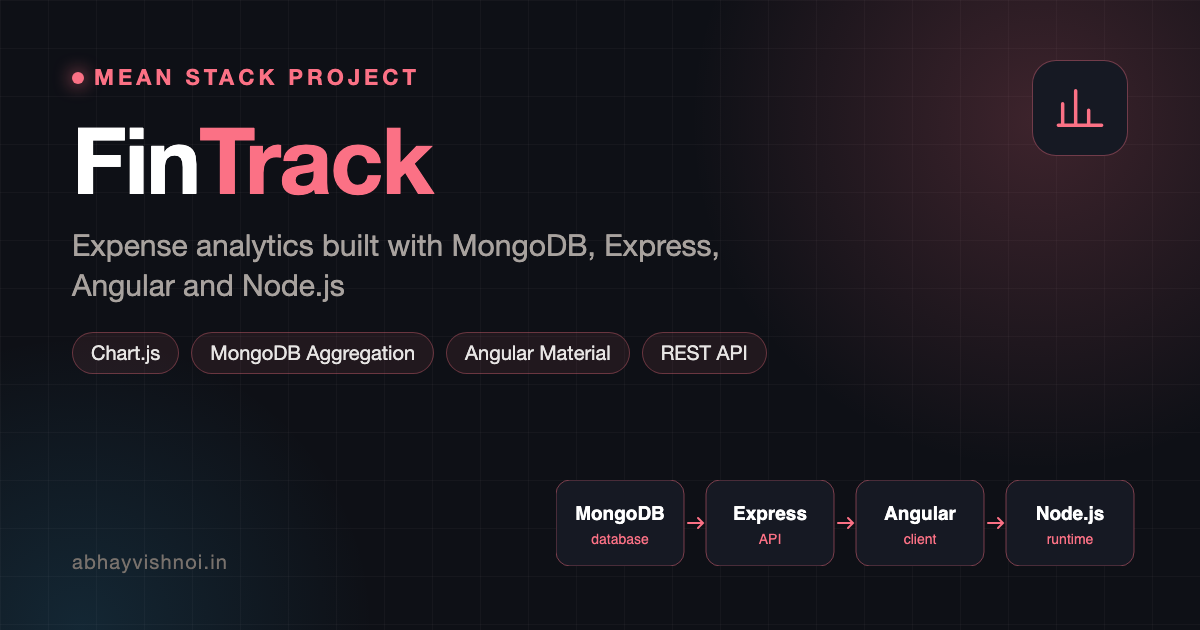
FinTrack is a personal finance and expense tracking dashboard built with the MEAN stack. It records income and spending, groups transactions by category and turns them into clear charts using MongoDB aggregation pipelines and Chart.js.
Data heavy MEAN stack development: aggregation pipelines on the server, reactive charts on the client and a dashboard that makes spending easy to understand.
Key features
Transactions and categories
Add income and expenses with categories, notes and dates, and edit or delete them at any time.
Monthly overview
See totals, savings and the biggest spending categories for any month at a glance.
Interactive charts
Chart.js visualises trends, category breakdowns and income versus expenses, and updates as filters change.
Budgets and alerts
Set a monthly budget per category and see progress bars that warn before the limit is reached.
Powerful filters
Filter by date range, category or amount and export the result to CSV.
Secure and private
Every request is authenticated and scoped to the signed in user.
How it works
- The user logs in and the Angular dashboard requests the summary for the selected month.
- Express runs a MongoDB aggregation pipeline that groups and sums transactions by category and day.
- The API returns compact, chart ready data instead of thousands of raw records.
- Angular passes the data to Chart.js components that animate between states.
- Changing a filter triggers a new request and the charts update without a page reload.
Architecture and design decisions
Analytics should stay fast as the data grows, so the heavy lifting happens inside the database rather than in the browser.
- Aggregation pipelines with $match, $group and $sort stages calculate totals close to the data.
- Compound indexes on user and date keep monthly queries quick.
- Typed DTOs shared by the API and the Angular services describe the shape of every response.
- Angular Material components provide accessible forms, tables and date pickers.
Tech stack
- MongoDBDatabase
- Express.jsAPI framework
- AngularFrontend
- Node.jsRuntime
- Chart.jsCharts
- Angular MaterialUI components
- MongooseData modelling
- TypeScriptLanguage
- RxJSReactive streams
What this project demonstrates
FinTrack demonstrates data modelling and analytics on MongoDB, efficient aggregation queries, clean charting in Angular and a dashboard experience that makes numbers meaningful for everyday users.
Tags
Recent Posts
 7 Oct, 2026
 InkSpace: Blog CMS with MEAN Stack and Angular Server-Side Rendering
InkSpace is a blogging platform and content management system built with the…
 5 Oct, 2026
 ShopSphere: MEAN Stack E-commerce Store with Stripe Payments
ShopSphere is a complete e-commerce store built with the MEAN stack. Shoppers…
 3 Oct, 2026
 ChatWave: Real-Time Chat App with MEAN Stack and Socket.IO
ChatWave is a real-time chat application built with the MEAN stack and…